User surveys
5.2 User surveys
An online survey conducted during this research had 310 respondents from across the region. 92% of respondents owned a smartphone, and of these the split is relatively even across operating systems (52% Android, 44% iOS with a range of unknowns and others) compared to international levels, where Android has over 70% market share (Netmarketshare.com, 2016). This high level of ownership, and international trends towards online consumption on mobile (internet browsing is now at over 30% mobile and rising at over 10% a year (Netmarketshare.com, 2016)), validates a ‘mobile first’ approach.
What follows are some key points of interest. The complete survey accompanies this research proposal as a separate document.
5.2.1 Do you use apps? Do you have any Hazard warning apps?
88% of users are either frequent app downloaders or regularly use a handful of useful apps, but 67% of users had no apps related to emergency preparedness or hazard warning. Where people indicated they did have this kind of app installed, Geonet was the overwhelming leader, followed by CPR/First Aid apps, and the Red Cross Hazard App.
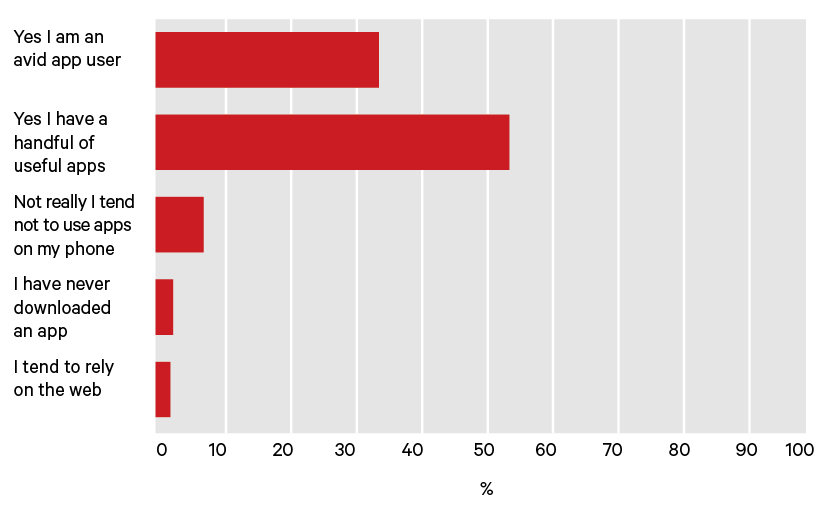
App usage amongst survey respondents
5.2.2 What social networks do you use?
In terms of social media, Facebook reigns supreme, but Neighbourly usage at over 25% is unexpectedly high.
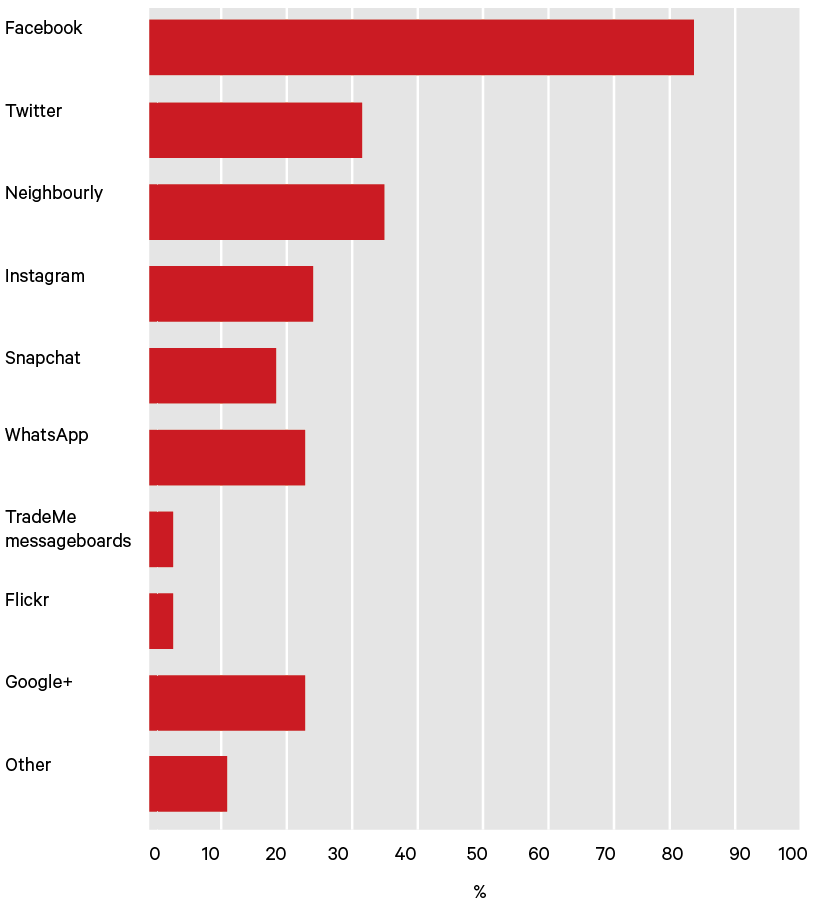
Social media usage amongst respondents
5.2.3 How did you hear about the 2011 Christchurch earthquakes?
This question was designed to reveal the relationship between New Zealanders’ information consumption habits and large scale disaster situations. Surprisingly a quarter of respondents became aware of the Christchurch earthquakes via television. More than email, the web and social media combined (20%). Word of mouth accounted for 18%.
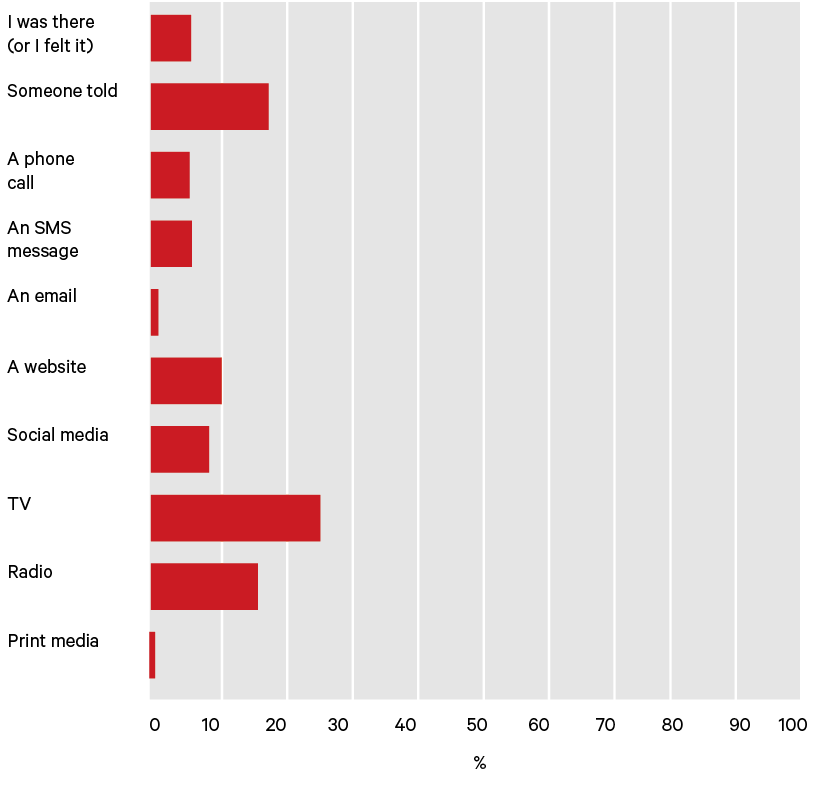
How users became aware of the Christchurch earthquakes
5.2.4 How do you know what’s happening in your community?
In an everyday context, though 54% of respondents highlighted social media as a place they found out about community events, traditional means such as a flyer in the mailbox (44% of respondents) remain important. In both the Christchurch question above and in regards to events, word of mouth remains a key communication channel.
17% of respondents knew none of their neighbours by name. 40% knew ~30% of their neighbours. But, despite the surprisingly high level of Neighbourly users in our sample, over 76% of respondents did not use online social networks to maintain connections with their immediate neighbours. Anecdotal feedback from an interview participant highlighted that Neighbourly is seen more as ‘Suburbly’ – not about conversations over the fence, more about conversations across the suburb.
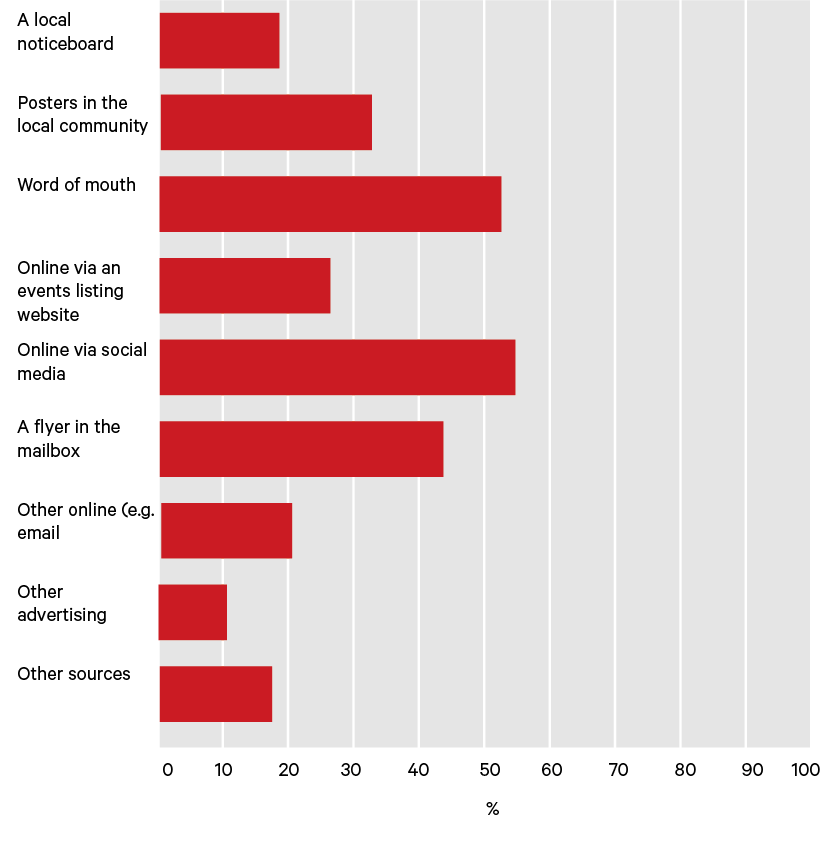
Where users find out about events in the community
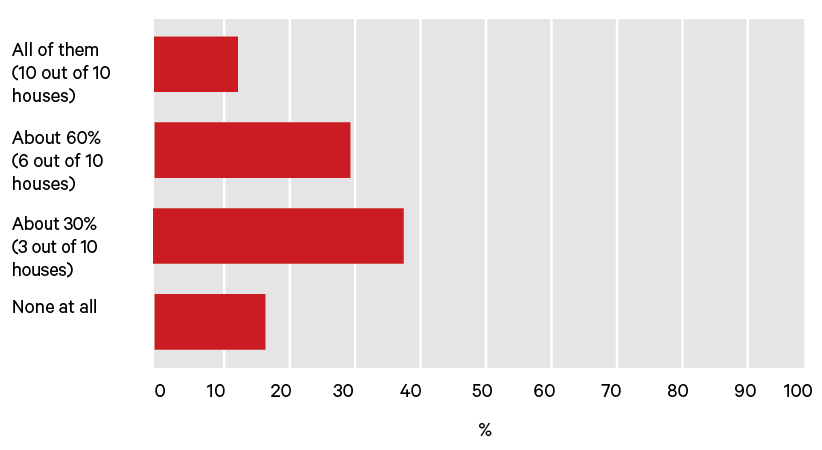
Respondent breakdown to the question ‘of your nearby neighbours, how many of them do you know at least by name?’
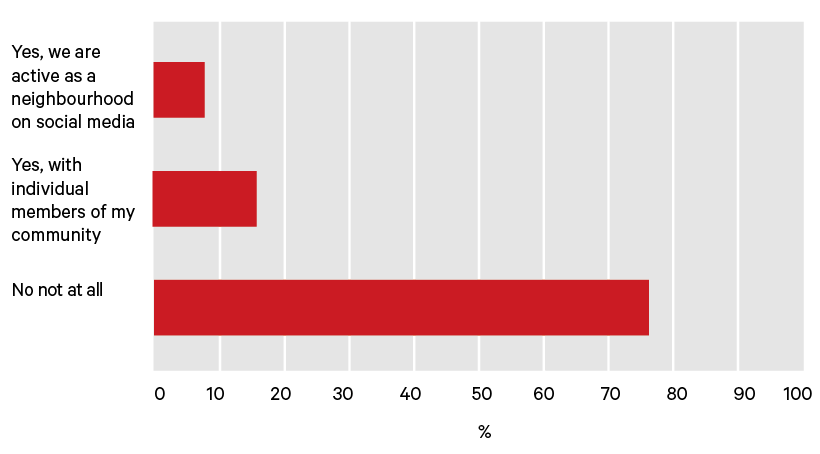
Respondent breakdown to the question ‘Do you use online social networks to maintain your connections with your neighbours?
5.2.5 Other responses of interest
In terms of preparedness, despite a possible bias towards people interested in civil defence, less than 30% of people have a comprehensive plan for an emergency situation, though 88% store water, and 41% have a nominated ‘out of region’ contact person.
92% of owners use maps on their smartphone, overwhelmingly Google Maps (94% of map users), suggesting a familiarity with geospatial systems on mobile devices. This relationship with Google became pertinent during user testing.